Vocabulary Dispersion Report

Analyze word dispersion.


The Vocabulary Dispersion Report analyzes the frequency and dispersion of all words in your text.

How to Use:
  1. Open a book.
  2. In the WordCruncher toolbar, go to Analyze > Book Reports > Vocabulary Dispersion Report.
Vocabulary Dispersion Report


Interpret the Report

Tip: Double-click on a word to search for it.

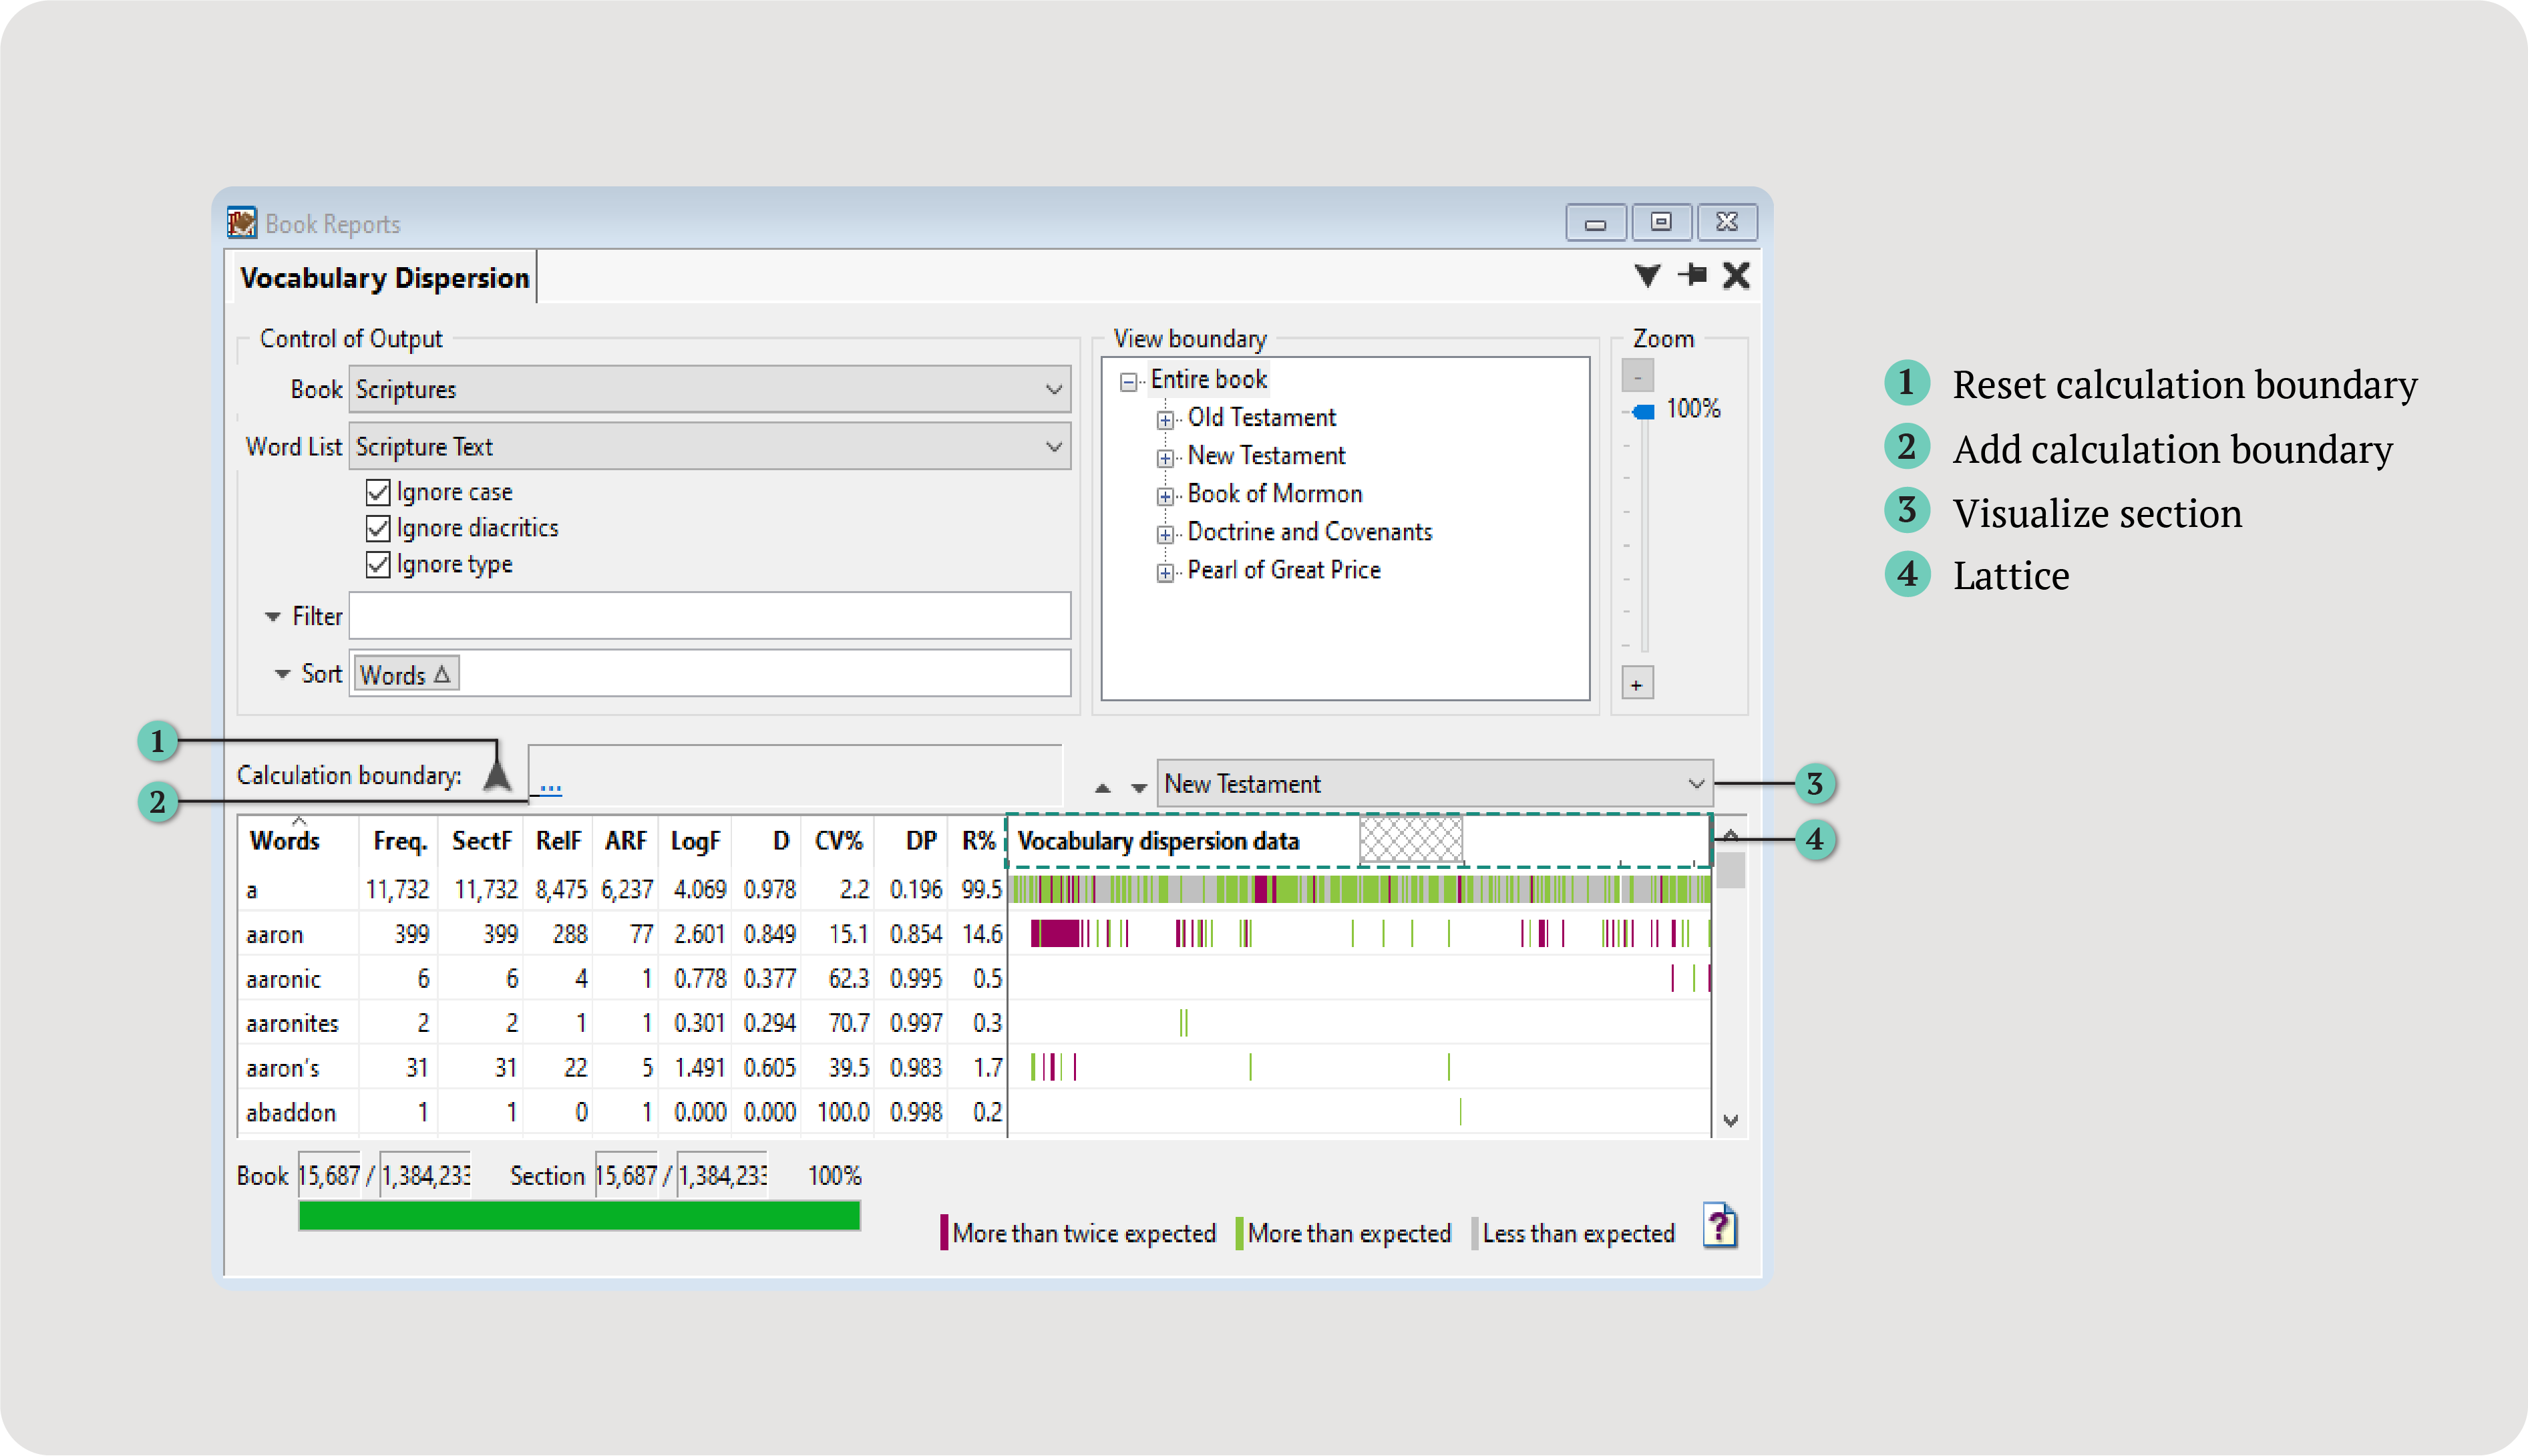
You can learn a lot about a word from its frequency and dispersion throughout a text. Here are a few definitions that will help you navigate the report:

  • Absolute Frequency: The total number of times a word appears in a text.
  • Normalized Frequency: An estimate of how many times each word would occur if the book or corpus contained exactly one million words. Normalized frequencies are useful for comparing word frequencies across texts of different sizes.
  • Even Dispersion: Imagine a text is divided into five sections of equal size. If a word occurs 100 times in each section, its dispersion is evenly dispersed. From this, you'll know that the word is consistently important throughout the entire text.
  • Uneven Dispersion: Imagine a text is divided into five sections of equal size. If a word occurs 500 times in one section, but not at all the other sections, the word is unevenly dispersed: this word is important for only one section of your text.

The report generates the following columns of frequency and dispersion data:

  • Words: The word.
  • Freq.: The absolute frequency (within the entire book).
  • SectF.: The frequency within the current section.
    If no section is selected, this column will be the same as Freq. column.
  • RelF.: Relative (normalized) frequency (counts per million).
  • ARF: Average reduced frequency. Combines absolute frequency and dispersion.
  • LogF.: Log10 Frequency. A frequency between 0 and 5. This statistic is used to account for low frequency words.
  • D: Juilland’s D. A number between 0 and 1, with 0 indicating an uneven dispersion and 1 indicating an even dispersion.
  • CV%: The coefficient of deviation by the maximum value of the CV. A percentage with 0 indicating an even dispersion and 1 indicating an uneven dispersion.
  • DP: Deviation of proportions. A number between 0 and 1. This column compares actual distribution with expected distribution, with 0 indicating an even dispersion and 1 indicating an uneven dispersion.
  • R%: Percent of ranges. The number of sections the word occurs in divided by the total number of sections in a book, with 0 indicating an uneven dispersion and 100 indicating an even dispersion.
  • Vocabulary dispersion data: A visual representation of the dispersion of each word. A mark represents a section of the book (by default, 2,000 words per mark), with the color indicating the word’s frequency in that section. The color of the mark indicates whether the word occurs less than expected, more than expected, or more than twice as much as expected.
    If you use the Visualize section dropdown, a lattice will appear in this column header to represent the section.
    Adjust the settings for colors and number of words per mark in user preferences.

To display additional columns, right-click > Show or Hide Columns > select columns.

For more information about the calculation of the Vocabulary Dispersion Report, visit Vocabulary Dispersion Statistics.


Customize the Report

Analyze a section of text, add a filter or sort, or visualize a specific section.

Calculation Boundary

Calculate the report columns based on only a section of the table of contents instead of the entire text (does not affect the Freq. column).

  • To select a section, click ....
  • To reset the calculation boundary, click the arrow icon.
Filter and Sort

Filter and sort the data by frequency, dispersion, and more. By default, the report is sorted alphabetically.
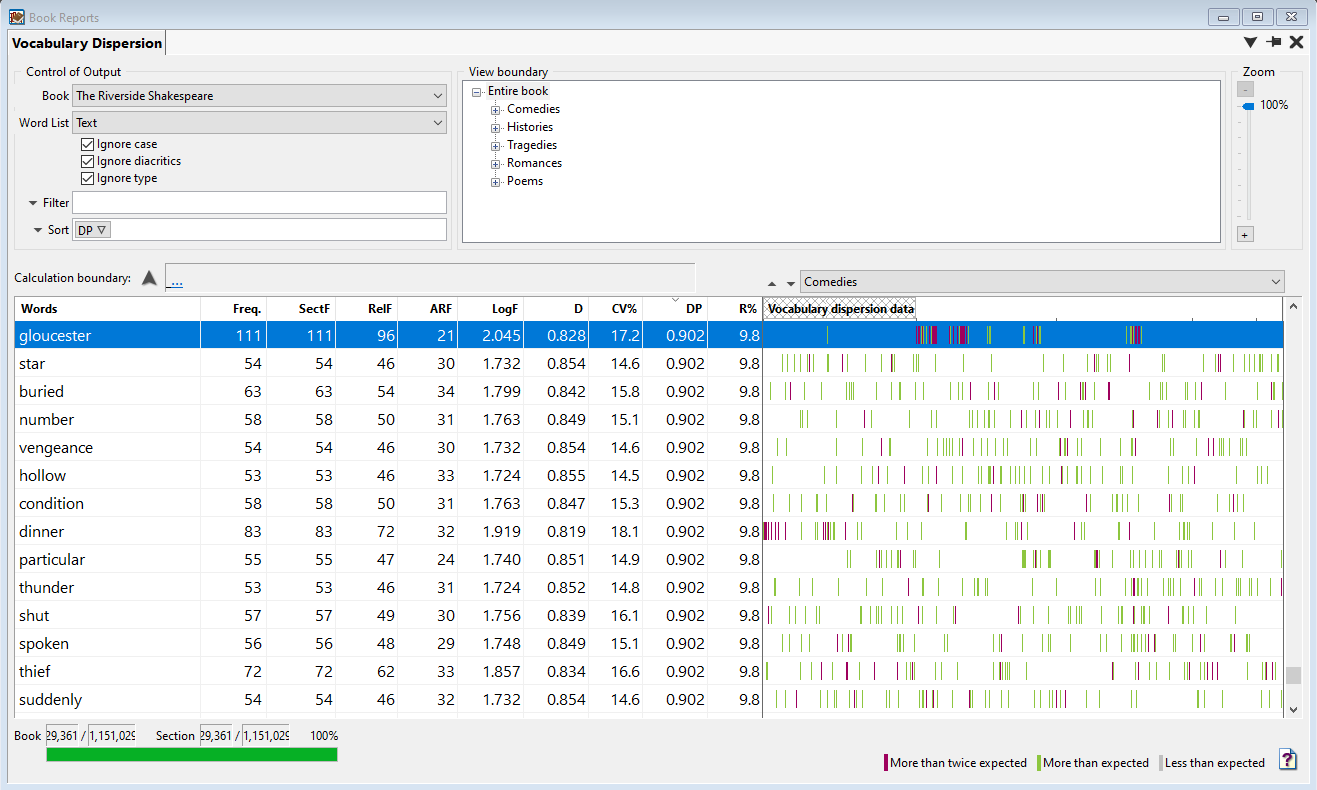
Example:
  1. Open the Vocabulary Dispersion Report.
  2. Click the Filter drop-down > Frequency.
  3. In the filter operation drop-down, select Greater than or equal to.
  4. In the Enter filter value(s) box, type 100.
  5. Click Add to list.
  6. Click OK.
  7. Click the DP column header to sort high to low.

In The Riverside Shakespeare, the word gloucester occurs 111 times with a DP of 0.902. The visualization shows a heavy concentration in the middle, with few to no instances in other sections.

Gloucester dispersion

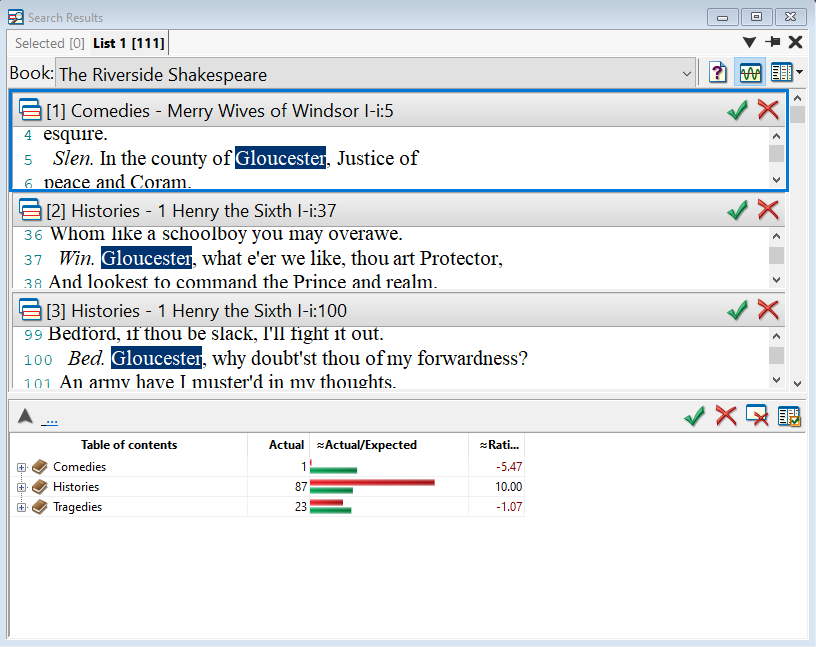
If we double-click on gloucester, this will search for the word and show its distribution. Gloucester appears 1 time in Shakespeare’s comedies, 87 times in histories, 23 times in tragedies, and not at all in romances or poems.


Gloucester search results
View Boundary

The View boundary pane will allow you to visualize dispersion in a smaller section of text. Click on a section to change the report view.

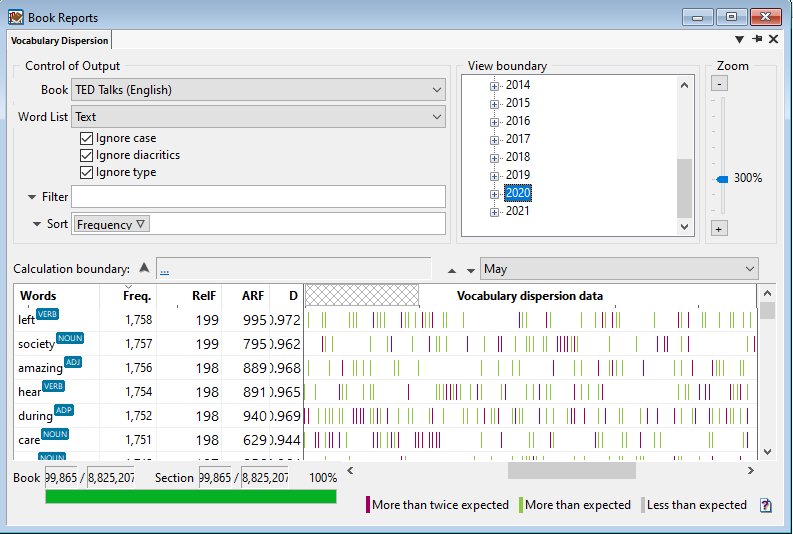
To see the location of a subsection, use the Visualize section drop-down. A lattice will appear in the Vocabulary dispersion data column. This lattice represents the subsection.

Example:
  1. Add a View boundary for 2020.
    The entire visualization will now represent 2020.
  2. Using the Visualize section drop-down, select May.
    The lattice will now represent May.
View Boundary Example