To change the columns displayed, right-click > Show or Hide Columns.
The report generates the following columns:
| Column |
Description |
Example |
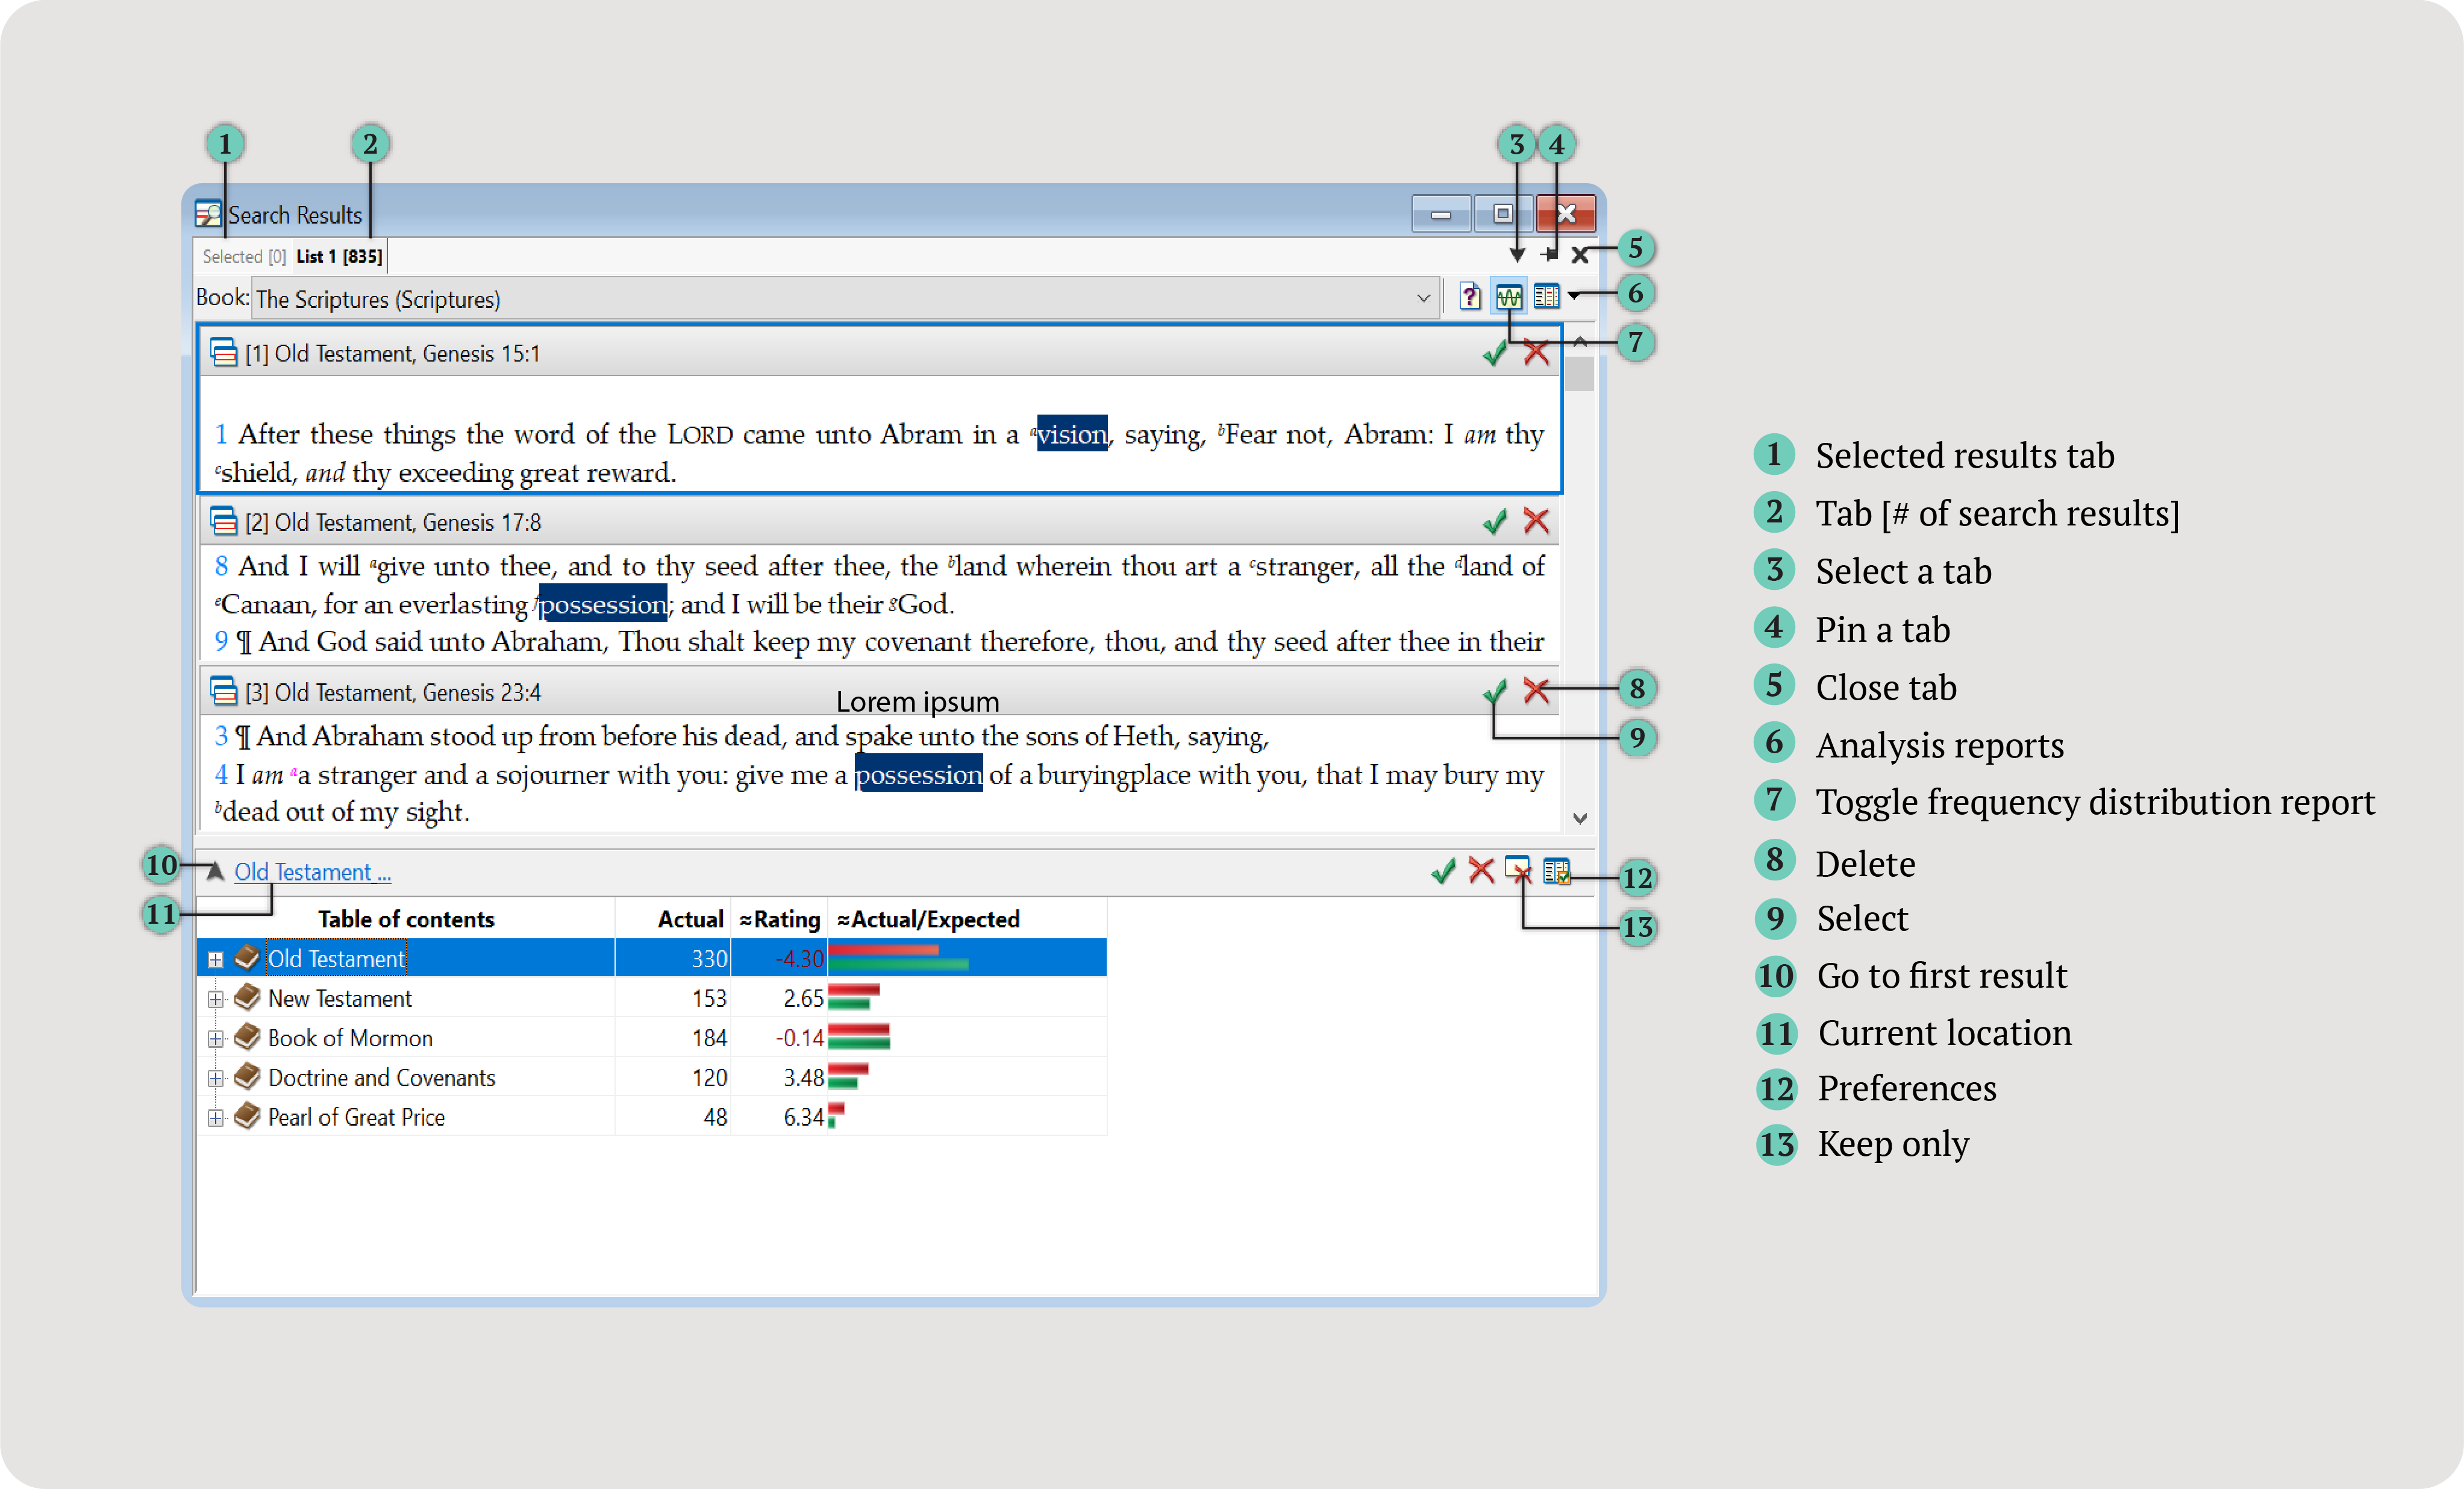
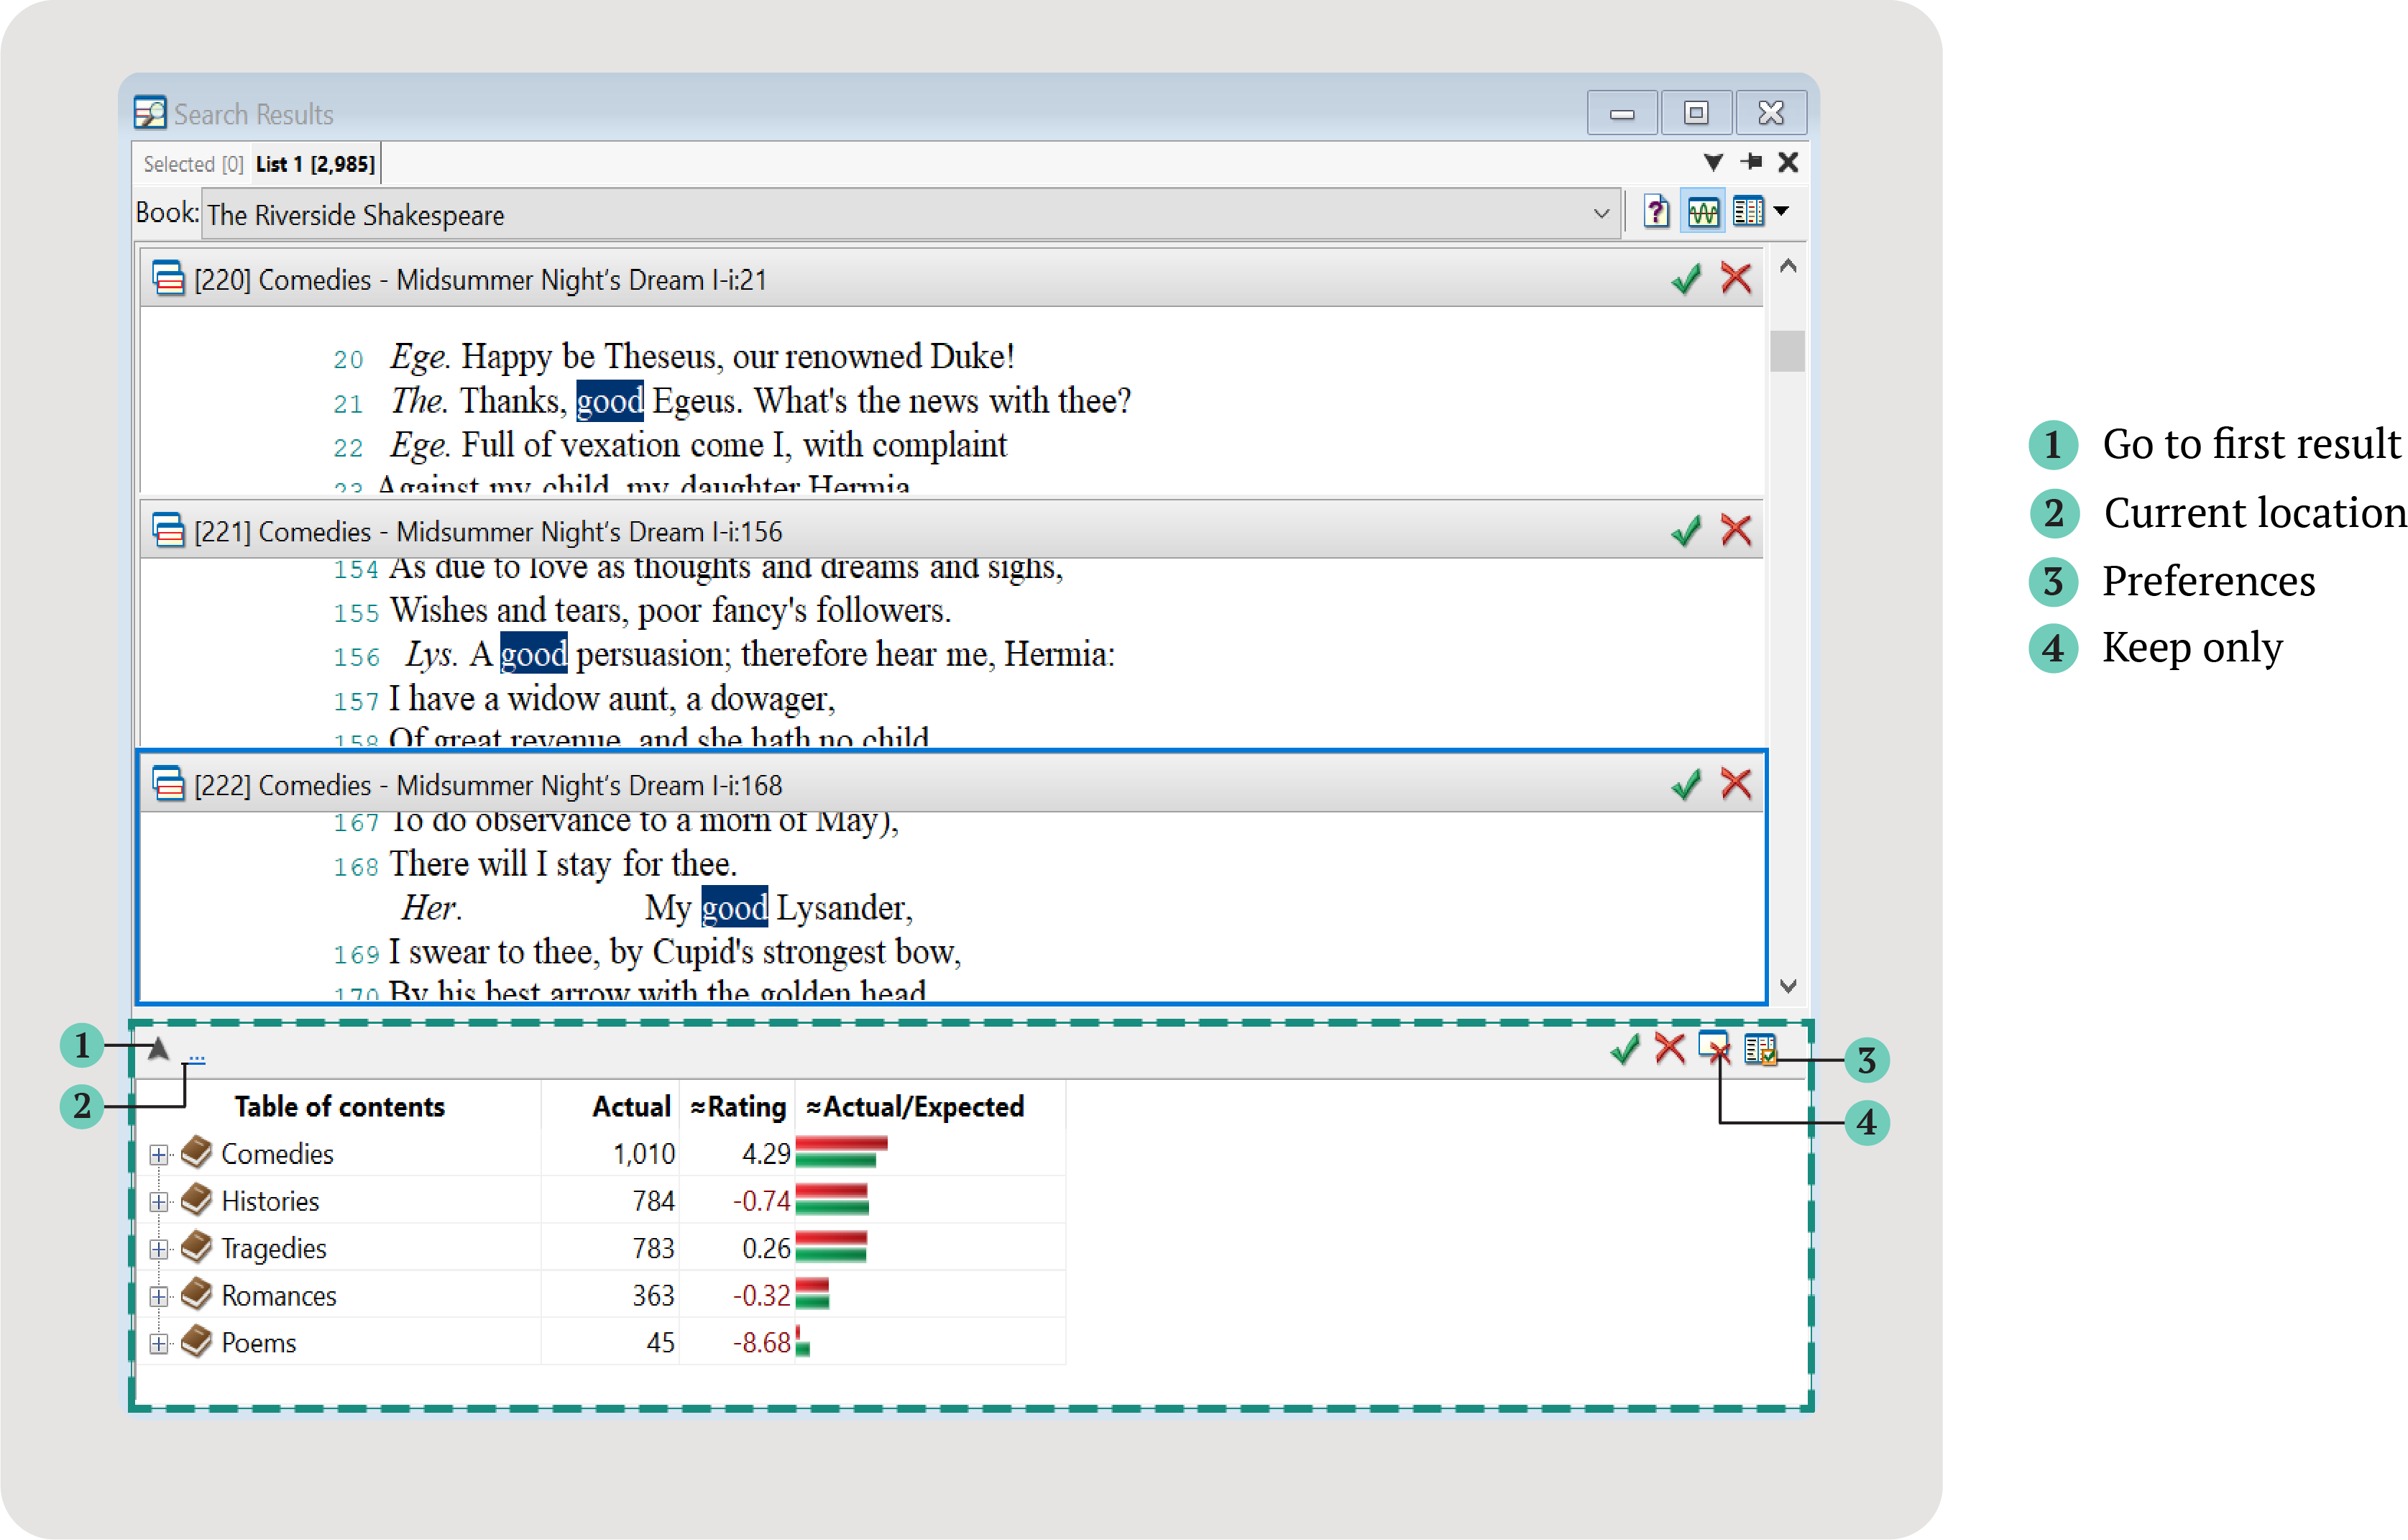
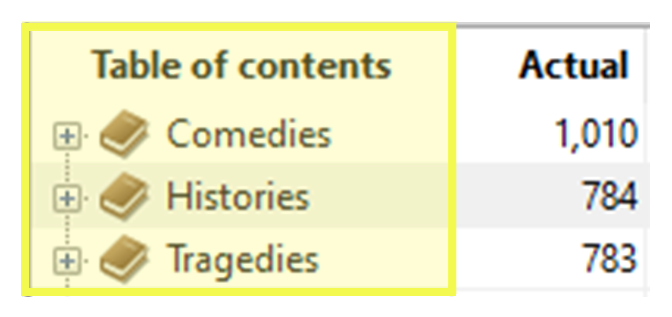
| Table of contents |
A list of the references within the book. References with 0 results are not shown.
The + button will display lower references, such as chapter and paragraph.
|
 |
| Actual |
The frequency of the search term within the reference. |
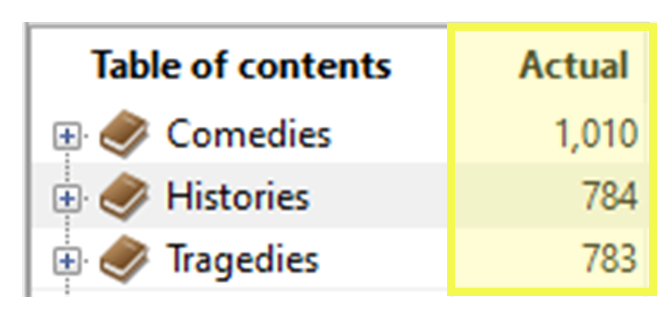
The search term occurs 1,010 times in Comedies. |
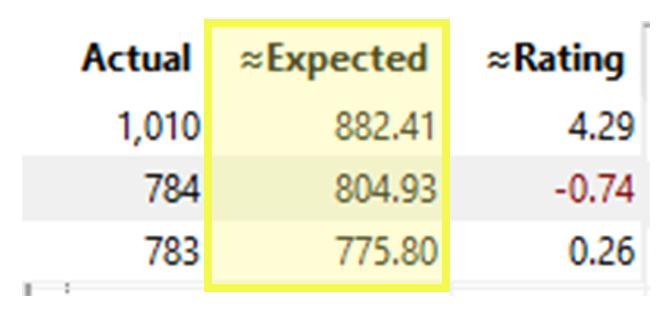
| ≈Expected |
If search hits were evenly distributed throughout the book, this is the number of hits we would expect to see in a given reference.
(Based on the size of the reference and the total number of search hits.)
If you place bounds on your search query, the
expected frequency will be inaccurate for the bound (using the expected of the whole section). Likewise, subwords or tagwords in your search argument will distort the statistic. There
is a size variable used in the computation, and it uses the number of normal words found within a reference. Many subwords or
tagwords can be associated with a single normal word, so this size variable inaccuracy will invalidate the statistic.
|
 |
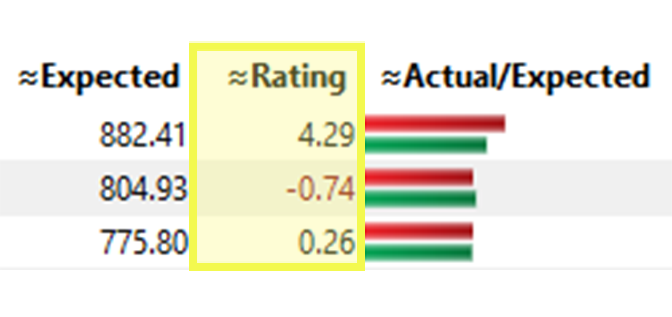
| Rating |
The rating has a range of -10.0 to +10.0. It quantifies the significance of the
number of search hits in each reference. The rating is not a statistic but attempts
to normalize the data by taking into account the size of the reference and the number of
search hits found in it. Learn more about the rating column below.
|
 |
| ≈Actual/Expected |
A bar chart comparing Actual Frequency (red) and Expected Frequency (green). |
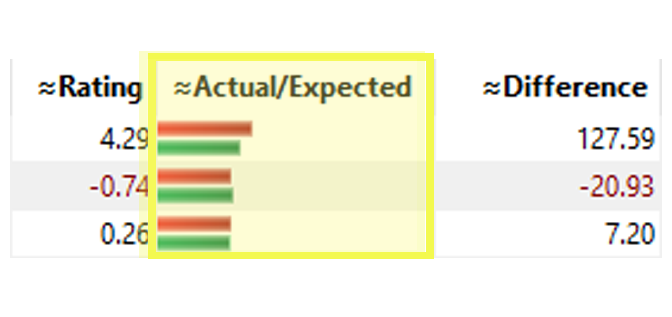 |
| Difference |
Actual frequency minus Expected frequency. |
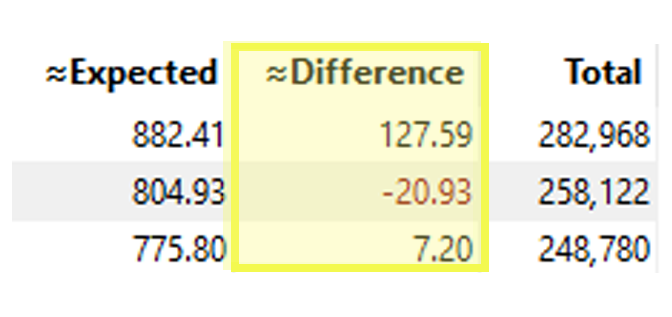 |
| Total |
The total number of words within the reference. |
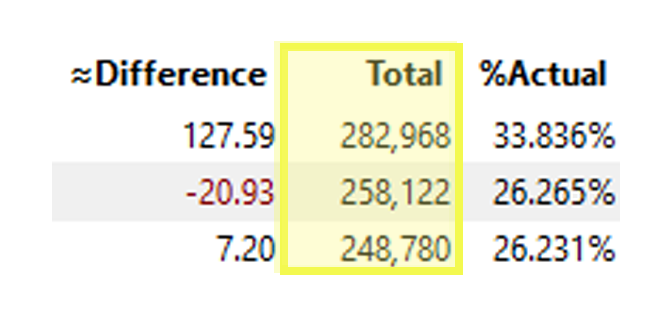 |
| %Actual |
The percent of the total number of hits found in each reference. |
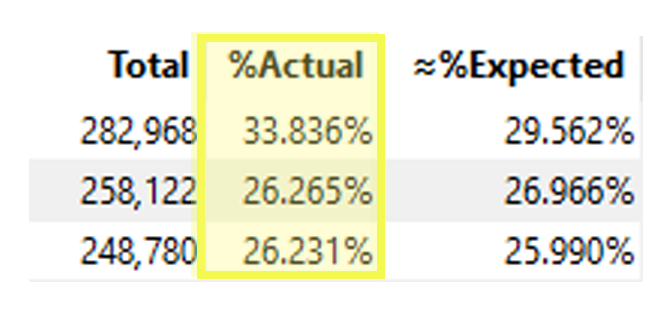 |
| ≈%Expected |
The relative size of the reference (the percent of the total text contained in each reference). |
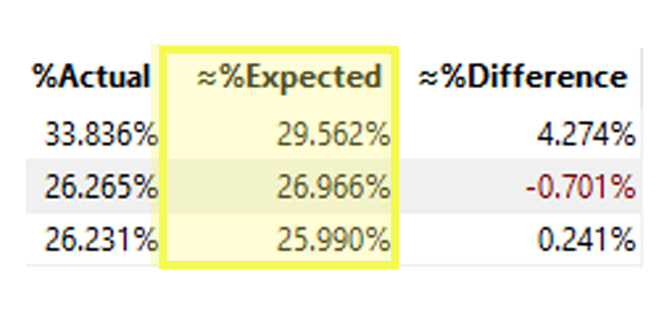 |
| %Difference |
% Actual frequency minus % Expected frequency. |
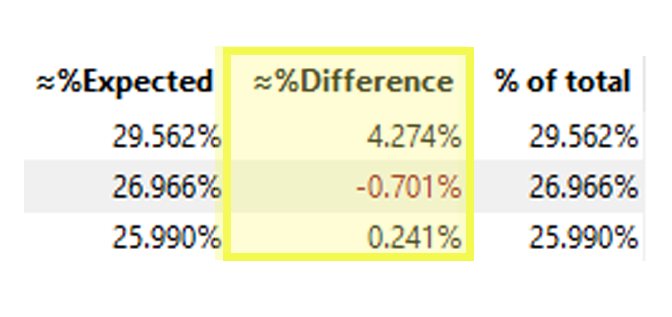 |
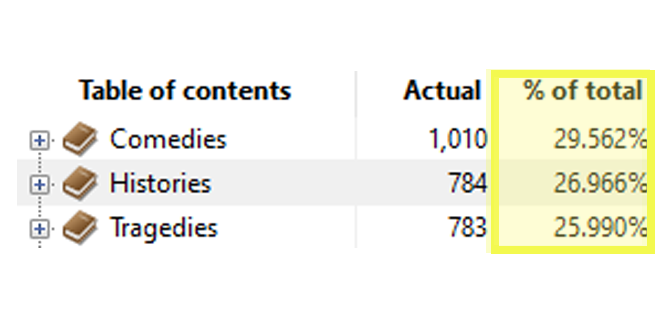
| % of total |
The size of the reference relative to the size of the entire book. When you add up all of the percentages
in this column, it should equal 100. Here, you can see that comedies are 29.562% of The Riverside
Shakespeare.
|
 |
Rating Column
The Rating column has a value between -10 and 10. If the rating
is closer to 10, the actual frequency is much higher than its expected frequency. This formula
is used to calculate the rating:
This formula is similar to calculating a chi-square statistic for each cell in a table.
To avoid dividing by 0, a 1 is added to the Expected value.
Ratings greater than 10.0 are rounded
down to 10.0.
Ratings less than -10.0 are rounded up to -10.0.
The expected values used in computing this rating are from Normal type words in the All Text (excluding
any text from your notes).
Note: If you place bounds on your search query, the expected frequency will be inaccurate for the bounded section.