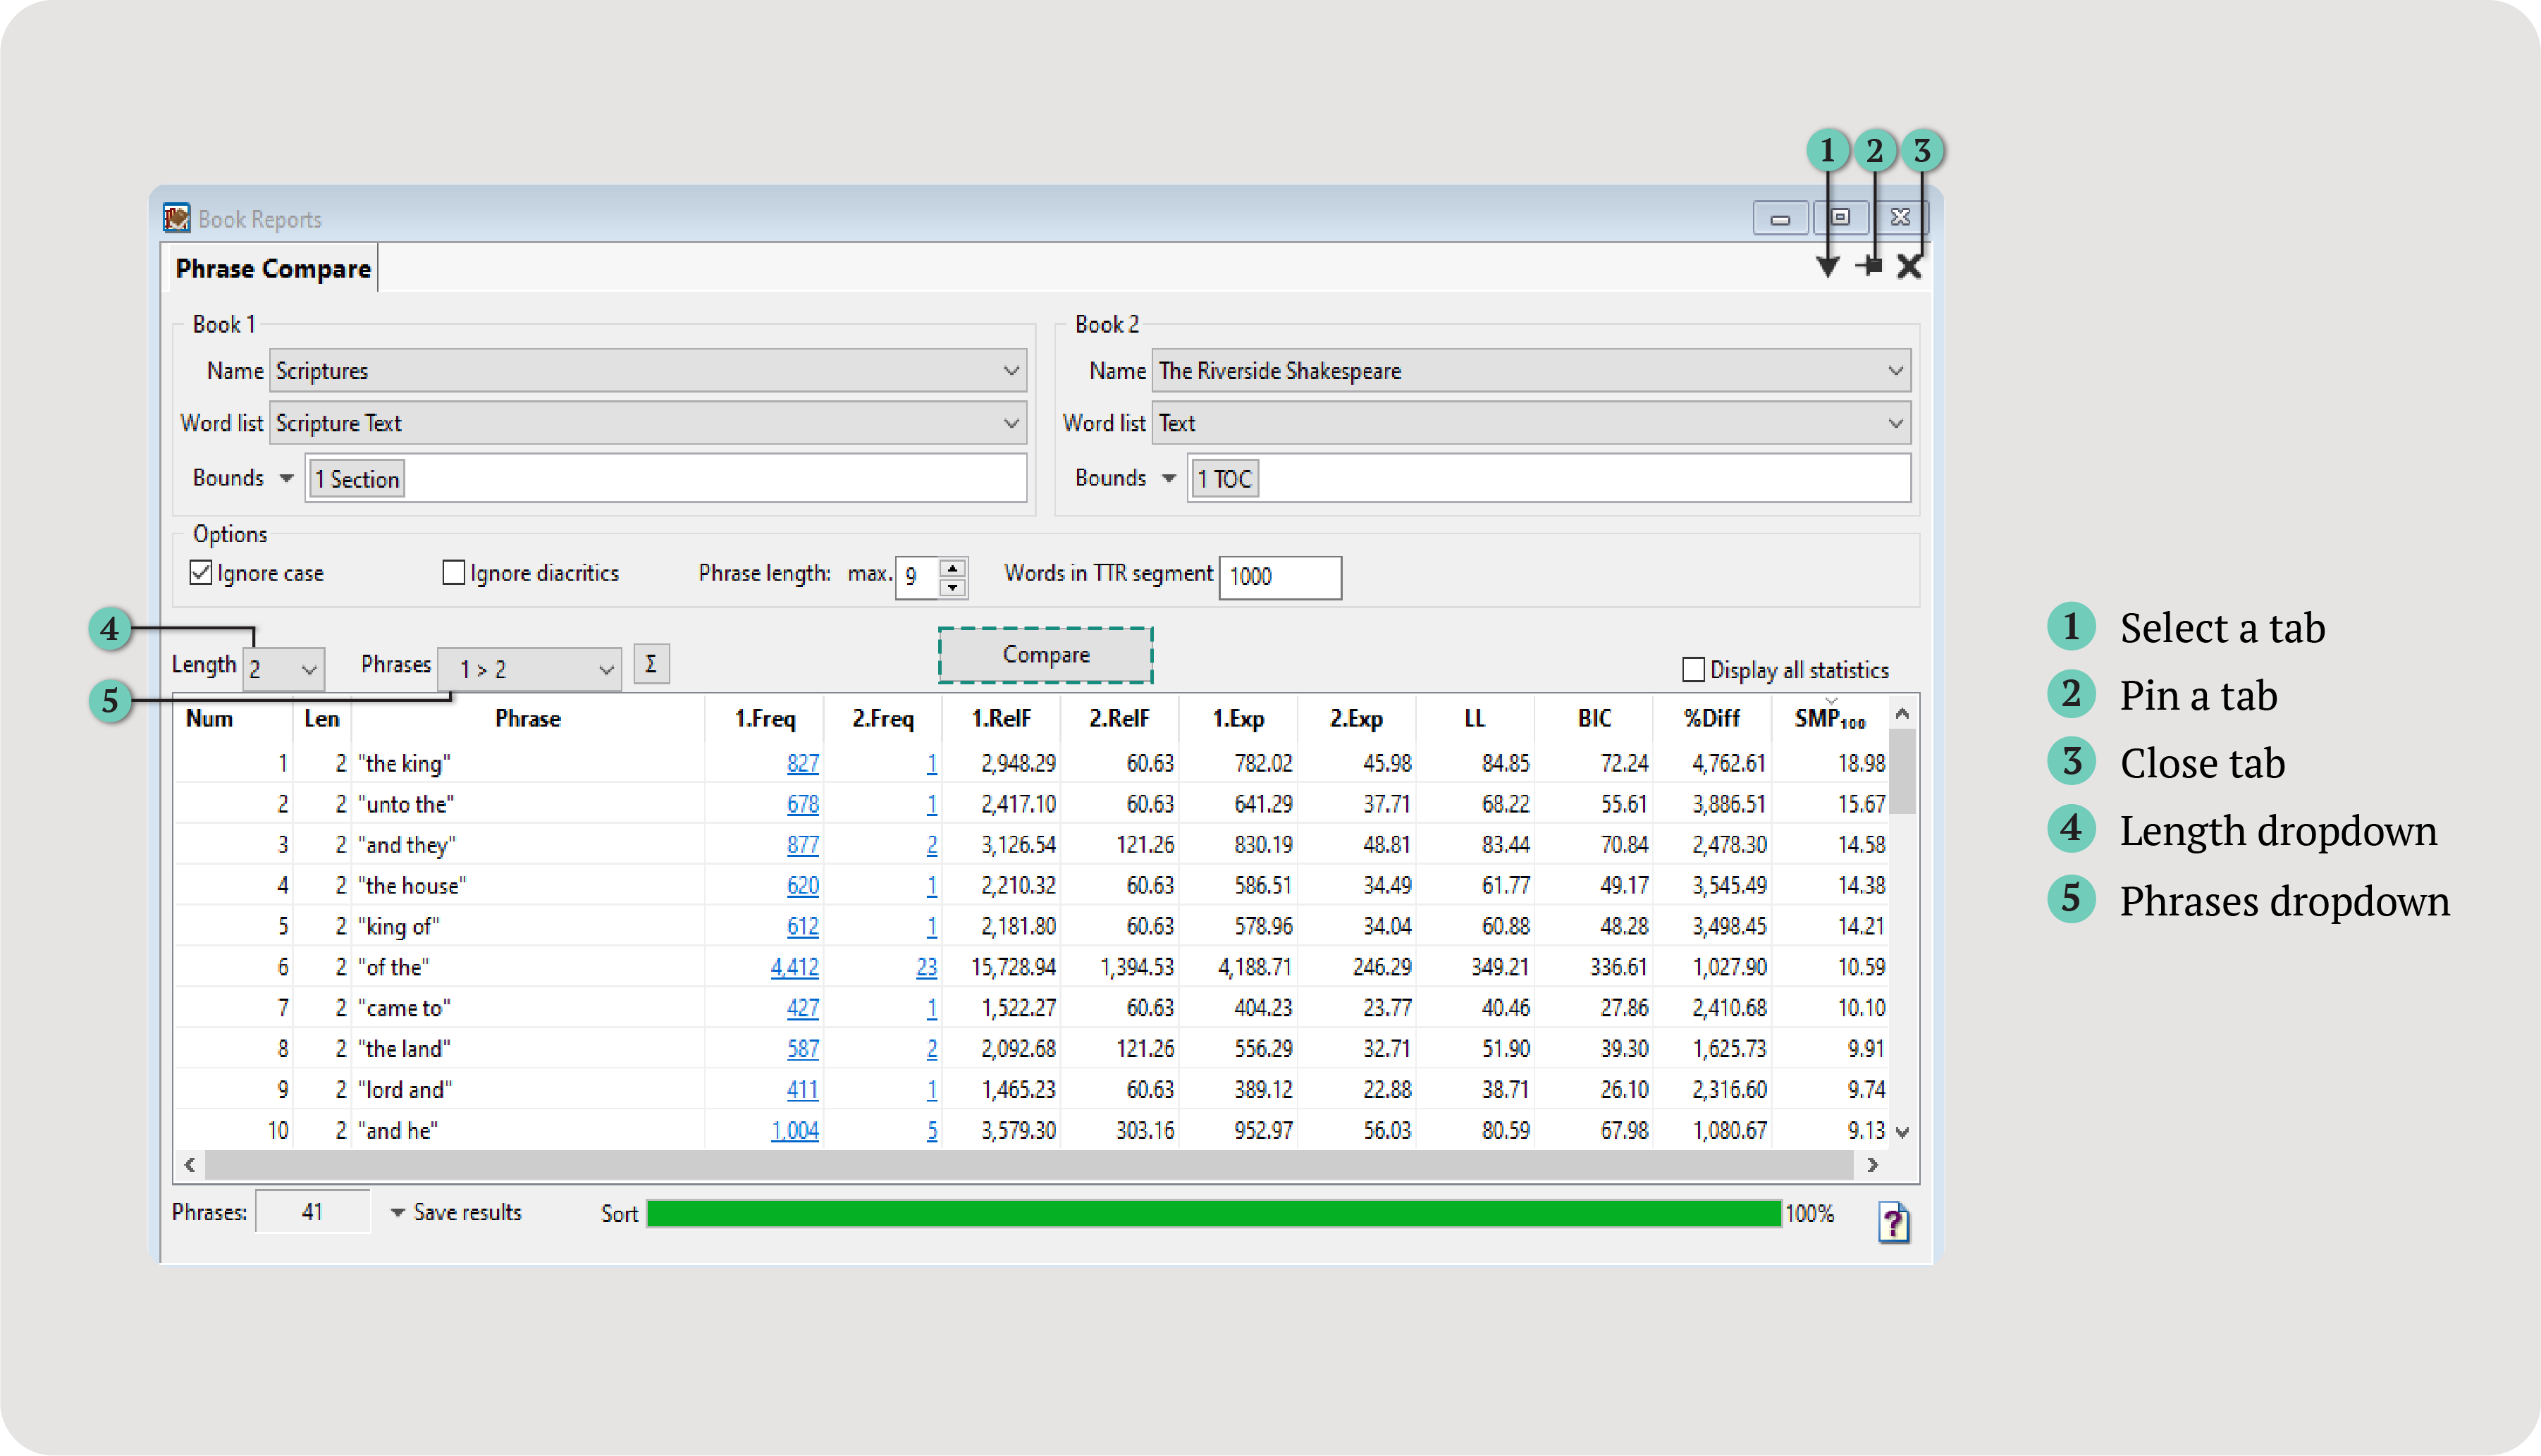
The Phrase Compare Report generates a table with data about each n-gram, its frequency, and more.
Num
The order of results.
Len
The length of the n-gram (number of words).
Phrase
The n-gram itself.
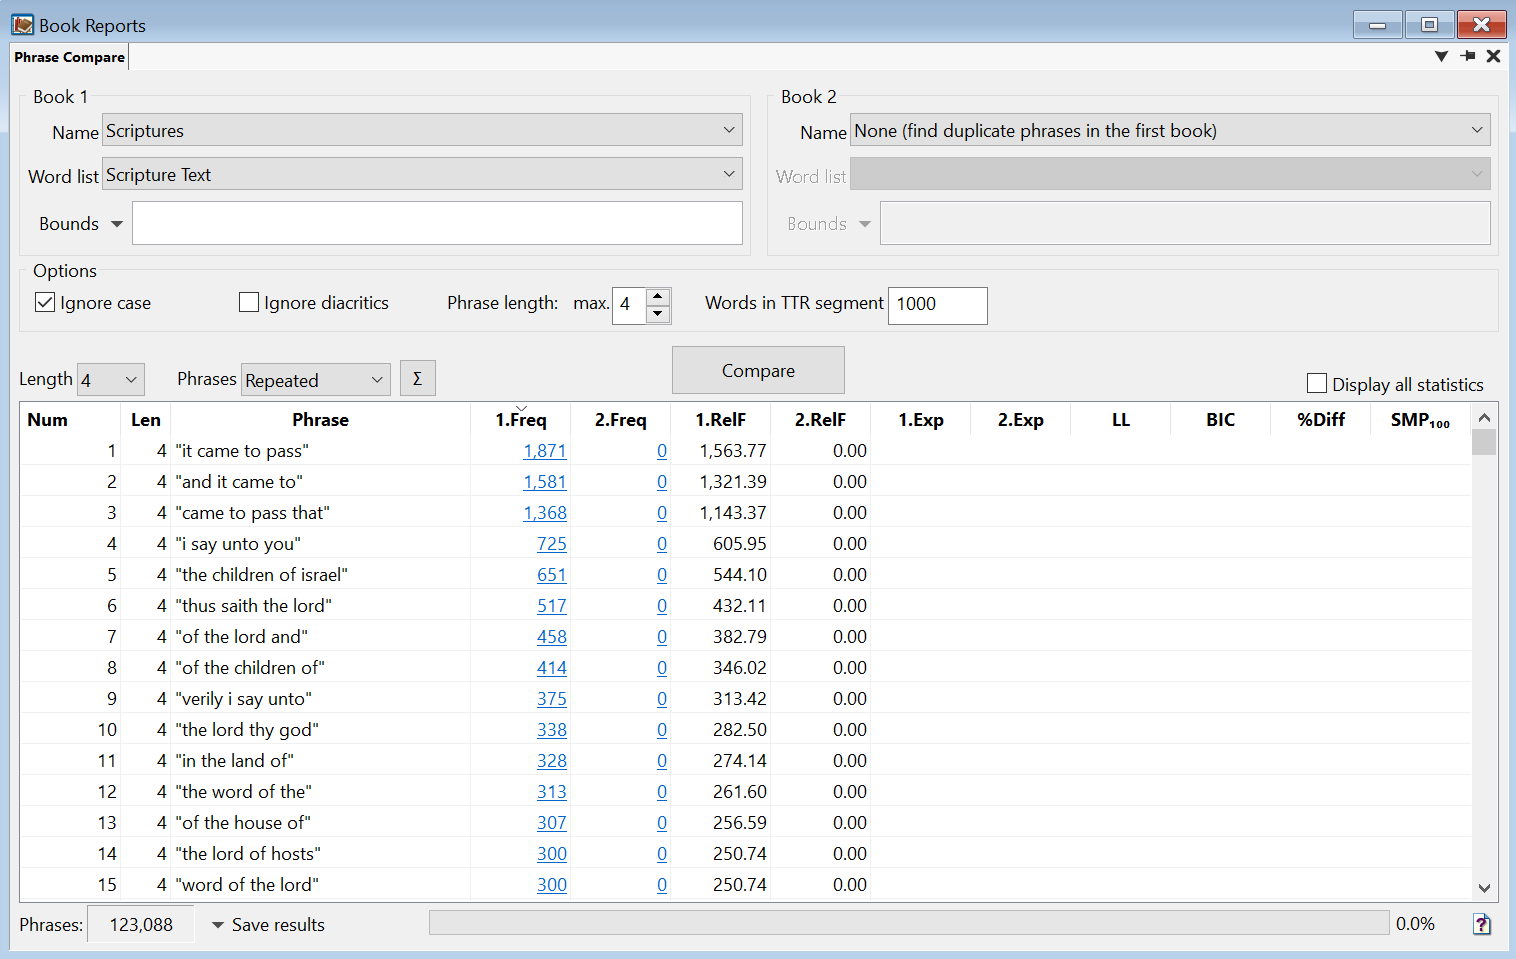
1.Freq and 2.Freq
The frequency of each n-gram in Book 1 (1.Freq) and Book 2 (2.Freq), if applicable.
1.RelF and 2.RelF
The relative frequency (RelF) per million words, a normalized measure, in Book 1 (1.RelF) and Book 2 (2.RelF).
Relative frequencies estimate how many times each phrase would occur if both books contained exactly one million phrases. For example, if a phrase occurred
10 times in 100 words (10%), and 10 times in 1000 words (1%), the raw frequencies are the same, but the relative frequencies are 100,000 and 10,000, respectively.
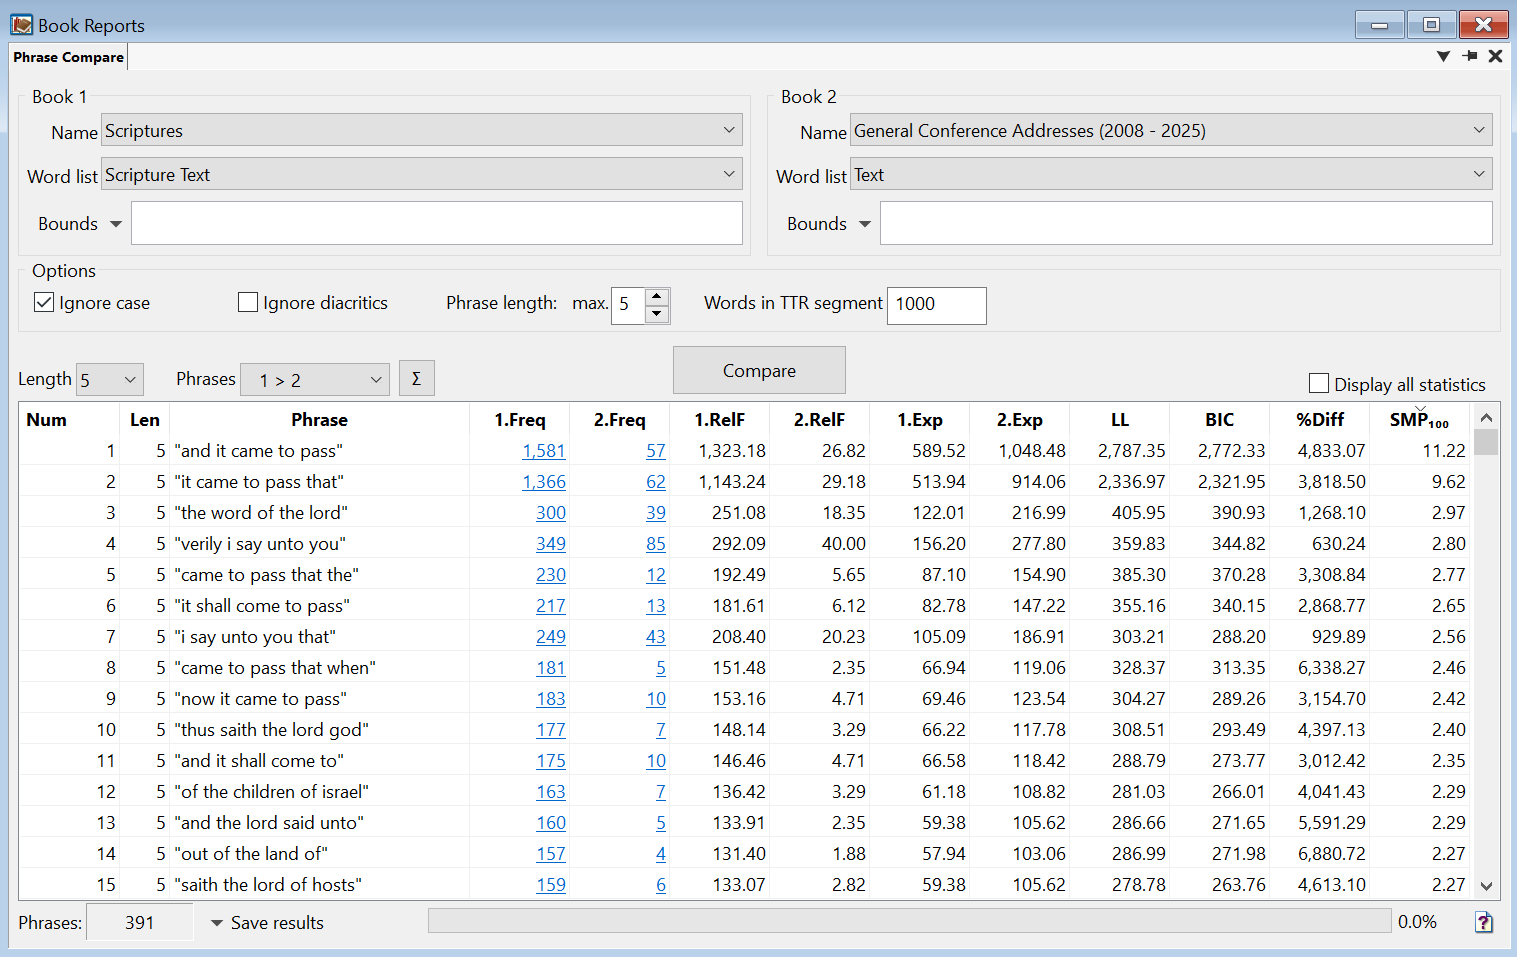
1.Exp and 2.Exp
The expected frequency of each n-gram in Book 1 (1.Exp) and Book 2 (2.Exp).
Expected frequencies are based on the probability of a result multiplied by the number of tries. For example, if you flip a coin 10 times, the expected number of heads would be
5 since the probability of heads is 50%. For a more detailed explanation of expected frequency, visit Phrase Compare Statistics.
BIC
Bayesian Information Factor (BIC): the main statistic used for comparing phrases.
BIC identifies phrases that do or do not occur statistically more often in Book 1 or Book 2. Significant phrases are calculated based on a book’s relative frequencies rather than its raw frequency.
|
List
|
BIC
|
| 1 > 2 |
BIC ≥ 2 |
| 2 > 1 |
BIC ≤ -2 |
| 1 ≈ 2 |
-2 < BIC < 2 |
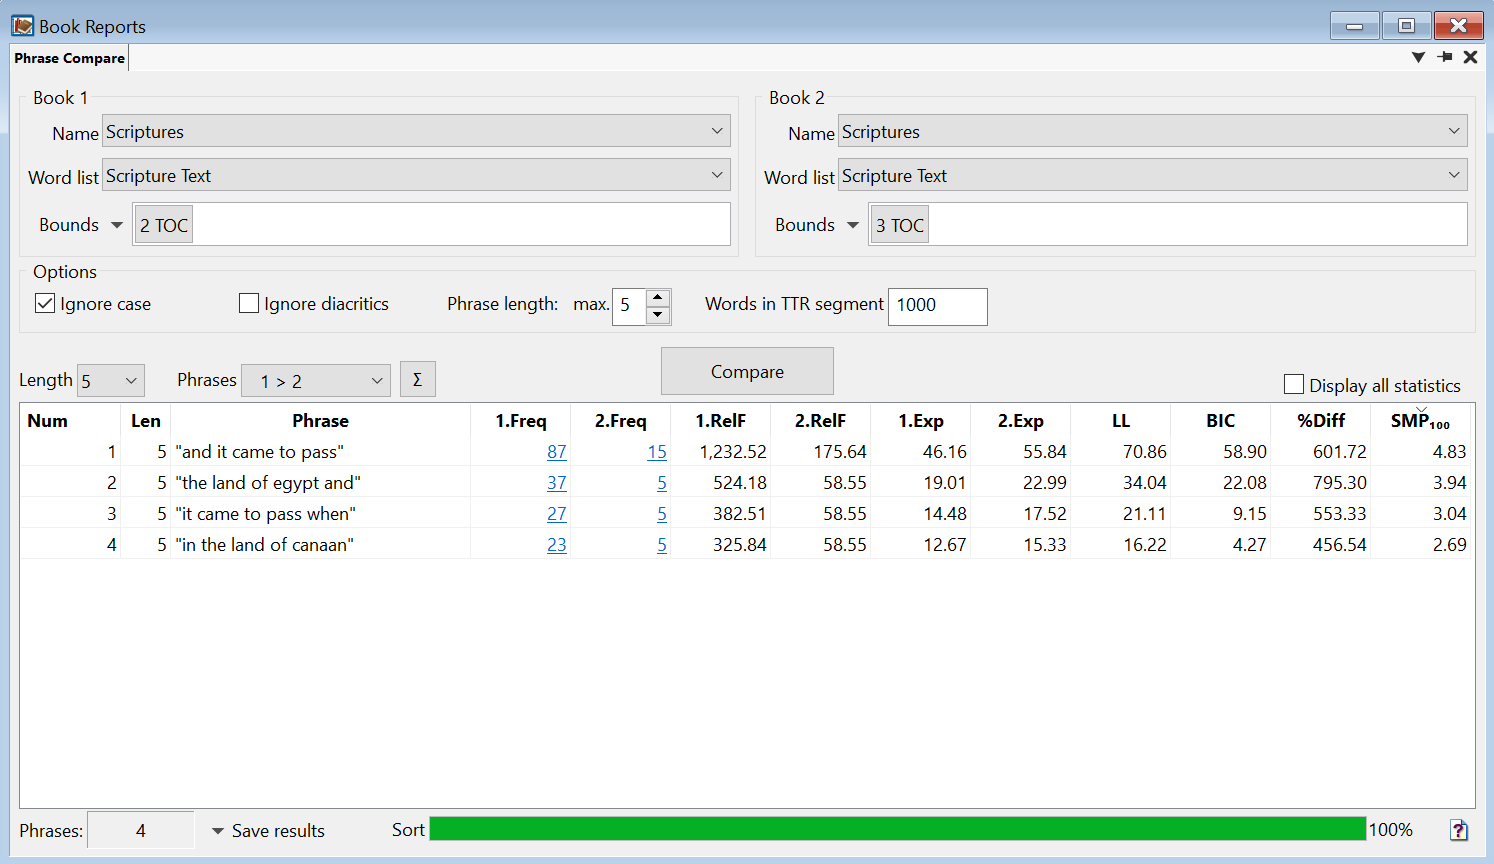
Each list is sorted by the SMP100 column.
SMP100
The Simple Maths Parameter (SMP) compares the relative frequency of each word or phrase in two texts.
For more information about the columns and statistics in the Phrase Compare Report, visit Phrase Compare Statistics.